Analyzing Stock Trends with Bollinger Bands, RSI, and MACD
Introduction
Successful trading and investing rely on effective stock market analysis tools to identify trends and potential trade signals. Whether you're a beginner learning technical analysis or an experienced trader optimizing strategies, using key technical indicators can enhance decision-making. In this guide, I'll walk you through a trading algorithm framework that fetches real-time stock data and computes essential indicators like Bollinger Bands, RSI (Relative Strength Index), and MACD (Moving Average Convergence Divergence). You'll also learn how to visualize stock trends for better insights.
This stock analysis script is especially useful for swing traders and active investors looking to identify potential trade signals and refine their trading strategies.
What This Trading Algorithm Does
This automated trading analysis script simplifies the process of retrieving stock market data and analyzing it with technical indicators. The provided pseudo code can be easily adapted to any programming language, making it accessible for traders using Python, JavaScript, or other languages. With advancements in Large Language Models (LLMs) like ChatGPT, Gemini, and DeepSeek R1, converting these algorithms into a working program has never been easier
✅ Fetches historical stock data e.g. from Yahoo Finance
✅ Calculates Bollinger Bands to analyze volatility
✅ Computes RSI to determine overbought and oversold conditions
✅ Generates MACD and Signal Lines to capture trend momentum
✅ Plots the analysis with clear visual indicators of buy/sell signals
By the end of this post, you'll see how to leverage the program for stock analysis and how to integrate these indicators into your own trading analysis.
example output:
Fetching Stock Data
The program fetches historical stock data for a given symbol and time period, removes missing values, and returns the cleaned data.
2️⃣ Calculating Bollinger Bands
Bollinger Bands consist of a middle moving average, with an upper and lower band defined as two standard deviations away.
📌 Trading Insight:
- If stock price touches the lower band, it may be oversold (potential buy opportunity).
- If stock price touches the upper band, it may be overbought (potential sell opportunity).
3️⃣ Calculating RSI (Relative Strength Index)
RSI measures stock momentum and identifies overbought (>70) and oversold (<30) conditions.
📌 Trading Insight, e.g. choose some thresholds:
- RSI > 70 → Stock is overbought (potential sell signal).
- RSI < 30 → Stock is oversold (potential buy signal).
4️⃣ Calculating MACD (Moving Average Convergence Divergence)
MACD is used to identify trend momentum by comparing short-term and long-term exponential moving averages.
📌 Trading Insight:
- MACD crosses above the signal line → Bullish momentum (buy signal).
- MACD crosses below the signal line → Bearish momentum (sell signal).
5️⃣ Generating Buy/Sell Signals
The program generates trading signals based on Bollinger Bands and RSI values.
📌 Trading Insight:
- Buy Signal (1): When stock price is below the lower Bollinger Band and RSI < 30.
- Sell Signal (-1): When stock price is above the upper Bollinger Band and RSI > 70.
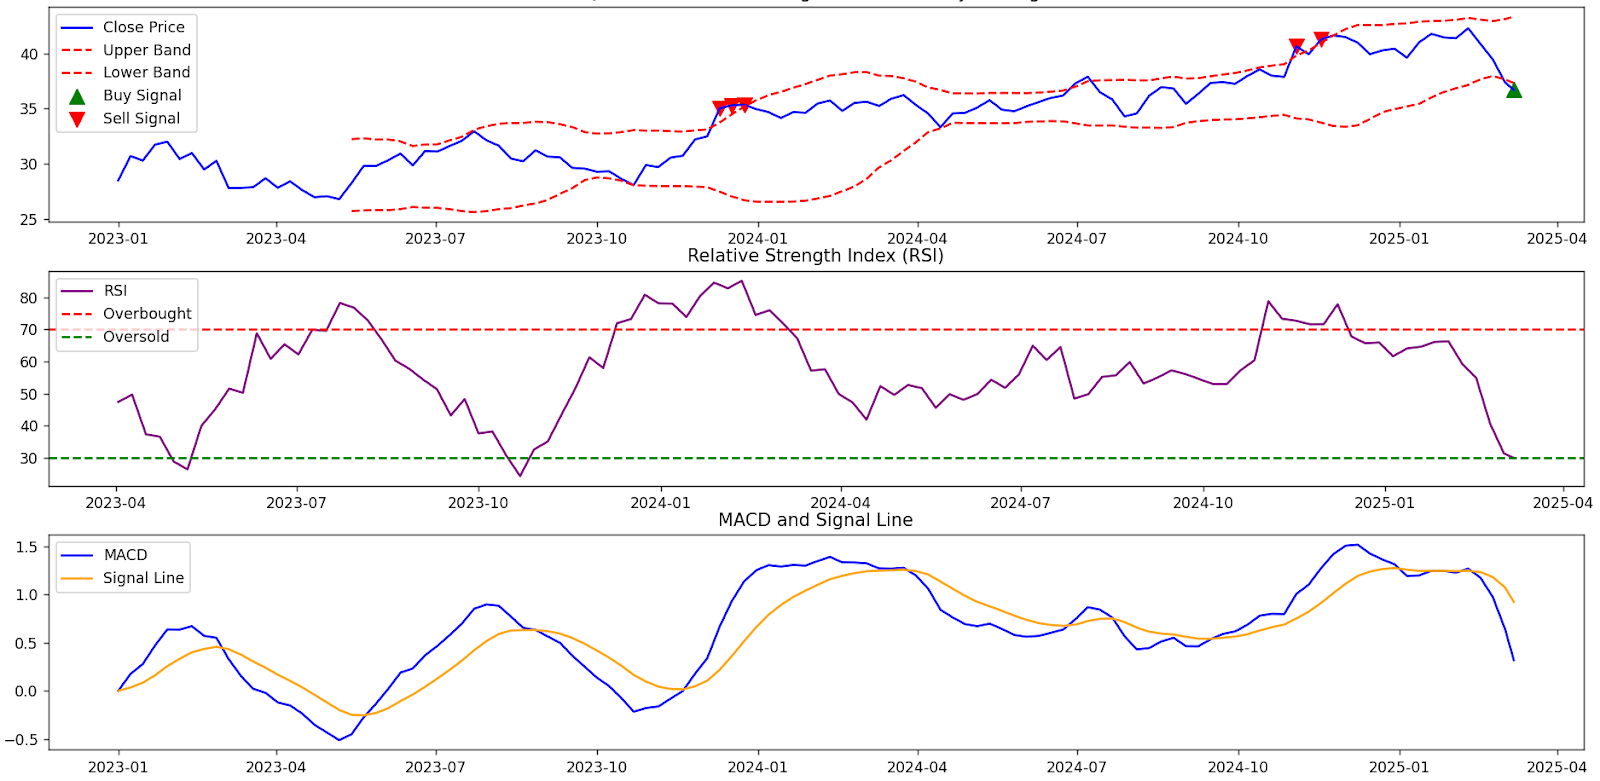
📊 Visualizing the Stock Analysis
The program plots stock price movements, Bollinger Bands, RSI, and MACD while highlighting buy/sell signals.
Final Thoughts: How Can This Help You?
This program is a powerful tool for traders who want to analyze stock trends automatically. By integrating Bollinger Bands, RSI, and MACD, this script provides valuable insights into potential buy/sell opportunities.
📌 Use Cases:
✔ Swing traders can use this to identify optimal entry/exit points.
✔ Long-term investors can track trends and confirm price momentum.
✔ Developers can modify and extend this script for custom strategies.
Whole program structure in Pseudo Code:
BEGIN
FUNCTION fetch_stock_data(symbol, start_date, end_date)
data ← Download stock data for symbol from start_date to end_date with weekly interval
Flatten the data index
Remove missing values from data
RETURN data
END FUNCTION
FUNCTION calculate_bollinger_bands(data, window=20)
    Compute moving average (MA) of 'Close' price over the given window
    Compute standard deviation (STD) of 'Close' price over the given window
    Compute Upper Band as MA + (2 * STD)
    Compute Lower Band as MA - (2 * STD)
END FUNCTION
FUNCTION calculate_RSI(data, window=14)
Compute daily price change (delta)
Compute gain as positive values of delta over the window
Compute loss as negative values of delta over the window
Compute Relative Strength (RS) as gain / loss
Compute RSI as 100 - (100 / (1 + RS))
END FUNCTION
FUNCTION calculate_MACD(data)
Compute 12-day Exponential Moving Average (EMA12) of 'Close' price
Compute 26-day Exponential Moving Average (EMA26) of 'Close' price
Compute MACD as EMA12 - EMA26
Compute Signal Line as 9-day EMA of MACD
END FUNCTION
FUNCTION generate_signals(data)
Initialize 'Signal' column with zero
SET 'Signal' to 1 (Buy) if 'Close' price < Lower Band AND RSI < 30
SET 'Signal' to -1 (Sell) if 'Close' price > Upper Band AND RSI > 70
END FUNCTION
FUNCTION plot_stock_analysis(data, symbol)
Create a figure with 3 subplots:
SUBPLOT 1: Stock Price with Bollinger Bands
Plot 'Close' price
Plot 'Upper Band' and 'Lower Band'
Mark Buy Signals with green upward arrow
Mark Sell Signals with red downward arrow
Add title and legend
SUBPLOT 2: RSI
Plot RSI values
Draw horizontal line at 70 (Overbought)
Draw horizontal line at 30 (Oversold)
Add title and legend
SUBPLOT 3: MACD
Plot MACD line
Plot Signal Line
Add title and legend
Adjust layout and display plot
END FUNCTION
// Main Execution Block
IF main program execution THEN
SET symbol to "AIEQ"
SET start_date to "2023-01-01"
SET end_date to "2025-12-31"
CALL fetch_stock_data(symbol, start_date, end_date) → data
CALL calculate_bollinger_bands(data)
CALL calculate_RSI(data)
CALL calculate_MACD(data)
PRINT column names of data (for verification)
CALL generate_signals(data)
CALL plot_stock_analysis(data, symbol)
END IF
END
Disclaimer: No Financial or Investment Advice
The content provided on this blog, including but not limited to stock analysis programs, trading strategies, technical indicators, and any related discussions, is for educational and informational purposes only.
🚨 Not Investment Advice
I am not a registered financial advisor, investment advisor, or broker-dealer. Nothing on this website should be interpreted as financial, investment, legal, or professional advice. The information presented here does not constitute a recommendation, offer, or solicitation to buy, sell, or hold any securities or financial instruments.
📉 Trading Risks
Trading and investing in stocks, options, cryptocurrencies, or any financial instruments involve significant risk, including the loss of principal. Past performance does not guarantee future results. You should conduct your own research, consider your personal financial situation, risk tolerance, and consult with a licensed financial professional before making any investment decisions.
💡 Use at Your Own Risk
Any software, code snippets, scripts, or trading strategies shared on this blog are for demonstration purposes only. I make no guarantees regarding their accuracy, reliability, or effectiveness. By using any information or software provided here, you agree that you are doing so at your own discretion and assume full responsibility for any outcomes.
⚖ Regulatory Compliance
Different countries and jurisdictions have different laws and regulations regarding trading and investment advice. It is your responsibility to ensure that your trading and investment activities comply with the applicable financial regulations in your region.
📜 No Liability
Under no circumstances shall I be liable for any direct, indirect, incidental, or consequential damages arising from your use of the information, tools, or code shared on this blog.
Attribution to OpenAI and ChatGPT
This blog may include content, code snippets, explanations, and narratives generated with the assistance of ChatGPT, an AI language model developed by OpenAI. ChatGPT was used as a tool to enhance the clarity, structure, and presentation of technical concepts in this post.
While AI-assisted content helps streamline information delivery, the final responsibility for accuracy, implementation, and interpretation rests with the author.
For more information about OpenAI and ChatGPT, visit https://openai.com.
📊 Attribution to Yahoo Finance
Stock price data is retrieved from Yahoo Finance using the yfinance Python package. Yahoo Finance is a publicly accessible financial data provider, and all stock prices used in this analysis are subject to their terms of service.
For more details, visit Yahoo Finance.

Comments
Post a Comment