Bayesian Gaussian Mixture Modeling for Stock Price Transformation & Prediction

Stock Price Prediction Using Bayesian Gaussian Mixture Model (BGMM)

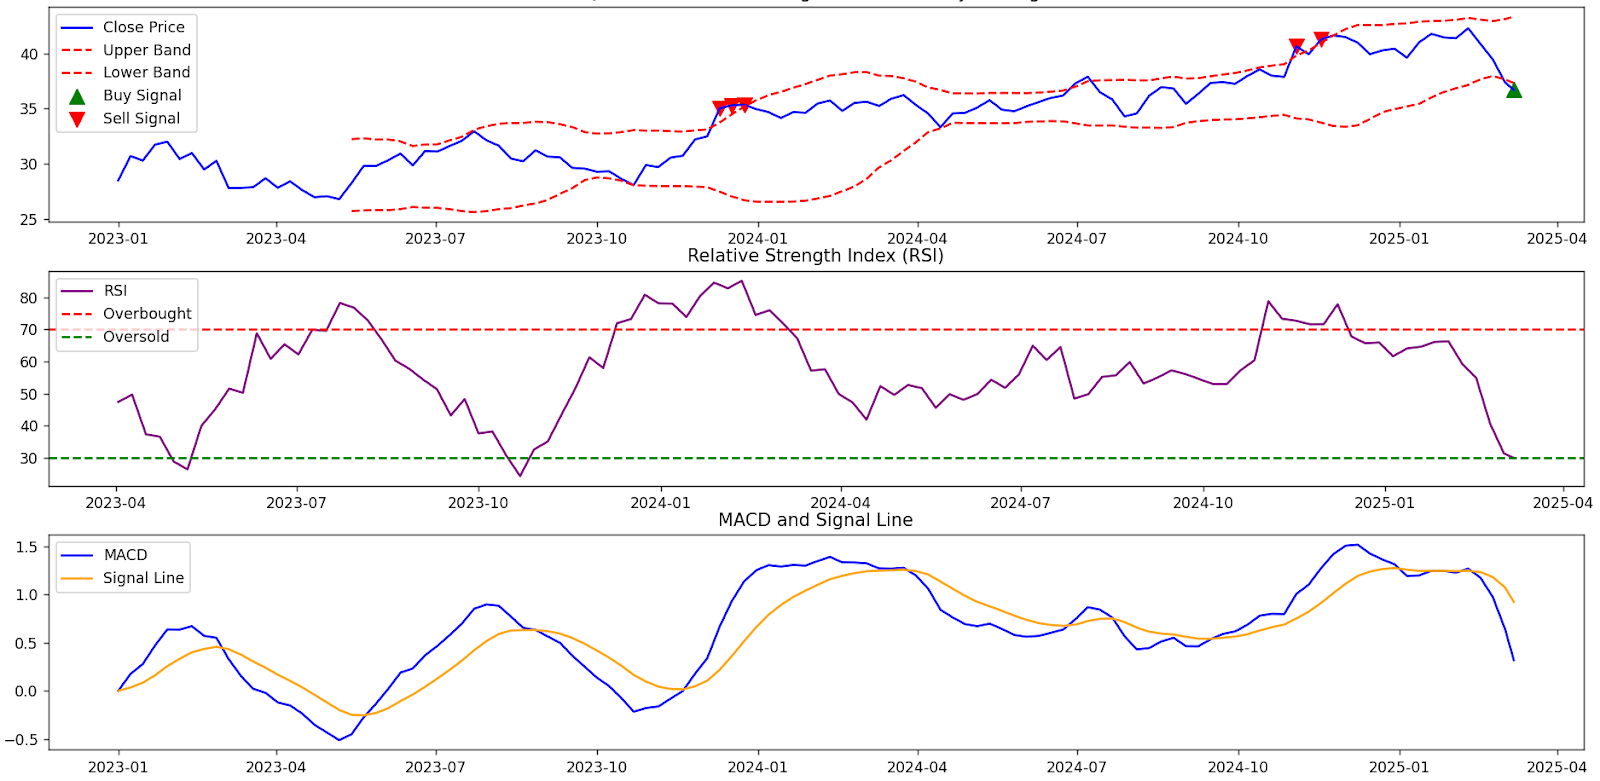
In this guide, we explore the Bayesian Gaussian Mixture Model (BGMM) and its application in transforming stock price data and generating numerical predictions. This method leverages historical stock data from Yahoo Finance, applies data transformation techniques, and fits a BGMM model to uncover hidden patterns in stock movements and make data-driven market forecasts.

The following example is presented in pseudo-code format, allowing for easy adaptation into any programming language. With modern Large Language Models (LLMs) like ChatGPT, Gemini, and DeepSeek R1, converting pseudo-code into a fully functional stock prediction script has never been simpler.


1️⃣ Fetching and Transforming Stock Data

Before applying statistical modeling, we first retrieve and transform historical stock price data.


FUNCTION fetch_transformed_stock_data(symbol, start_date, end_date) TRY // Download stock data for the given symbol stock_data ← Download stock data from Yahoo Finance for symbol from start_date to end_date // Check if data is available IF stock_data is EMPTY THEN PRINT "No data available for symbol in the specified date range." RETURN empty lists // Extract the closing prices from stock data closing_prices ← Extract 'Close' column as a list // Apply a transformation: (price * day_index) + 1 transformed_prices ← CREATE empty list FOR each price in closing_prices: transformed_value ← (price * (index + 1)) + 1 ADD transformed_value to transformed_prices PRINT "Fetched and transformed data for symbol." RETURN transformed_prices, closing_prices CATCH EXCEPTION e PRINT "Error occurred while fetching data:", e RETURN empty lists END FUNCTION // Define parameters for stock symbol and date range DEFINE symbol AS "AIEQ" DEFINE start_date AS "2023-01-01" DEFINE end_date AS "2025-12-31" // Fetch and transform stock data CALL fetch_transformed_stock_data(symbol, start_date, end_date)

📌 Purpose of Data Transformation

  • Converts raw stock prices into a numerically transformed dataset.
  • Ensures data is formatted properly for further statistical processing.

2️⃣ Bayesian Gaussian Mixture Model (BGMM) for Stock Data

A Bayesian Gaussian Mixture Model (BGMM) is a probabilistic approach used to analyze distributions within data. This function fits a BGMM model to the transformed stock data.


FUNCTION fit_bayesian_gaussian(data, n_components=2) // Convert data to NumPy array and reshape for model compatibility reshaped_data ← Convert data into a NumPy array with a single column // Initialize and fit a Bayesian Gaussian Mixture Model bgmm ← Initialize BGMM with n_components FIT bgmm using reshaped_data RETURN trained bgmm END FUNCTION // Example usage: CALL fit_bayesian_gaussian(transformed_prices, n_components=2)

📌 Purpose of BGMM

  • Models distributions in stock data.
  • Estimates underlying statistical structure of transformed prices.

3️⃣ Predicting Future Price Movements Using BGMM

This function uses the trained BGMM model to generate numerical predictions.


FUNCTION predict_directions_and_magnitudes(transformed_data, original_data, num_predictions=3) // Check if data is available IF transformed_data is EMPTY THEN PRINT "No data available for prediction." RETURN empty list // Retrieve the last transformed and original prices last_transformed_price ← LAST_VALUE(transformed_data) last_original_price ← LAST_VALUE(original_data) // Fit BGMM model to transformed data bgmm ← CALL fit_bayesian_gaussian(transformed_data, n_components=2) // Generate 100 synthetic predictions from the model predicted_transformed_prices ← SAMPLE 100 values from bgmm // Convert predicted transformed values back to original price scale predictions ← CREATE empty list FOR each predicted_transformed_value in predicted_transformed_prices (first num_predictions): converted_price ← (predicted_transformed_value - 1) / (LENGTH(original_data) + index + 1) ADD converted_price to predictions // Compute direction (Up/Down) and relative errors directions ← CREATE empty list relative_errors ← CREATE empty list FOR each predicted_price in predictions: IF predicted_price >= last_original_price THEN ADD "Up" to directions ELSE ADD "Down" to directions relative_error ← ABS(predicted_price - last_original_price) / last_original_price ADD relative_error to relative_errors // Format predictions summary predictions_summary ← CREATE empty list FOR i in RANGE(num_predictions): ADD { "Prediction": i + 1, "Predicted Price": predictions[i], "Direction": directions[i], "Relative Error": relative_errors[i] } to predictions_summary RETURN predictions_summary END FUNCTION // Call function to generate predictions CALL predict_directions_and_magnitudes(transformed_data, original_data, num_predictions=3)

📌 Purpose of Predictions

  • Uses Bayesian modeling to generate numerical outputs.
  • Provides relative comparisons between transformed and original prices.

4️⃣ Displaying Numerical Predictions

This function formats and displays the computed predictions.


FUNCTION display_predictions(predictions_summary, last_price) PRINT "Last Recorded Price:", last_price FOR each prediction in predictions_summary: PRINT "Prediction ", prediction["Prediction"], ":" PRINT " Predicted Price = ", prediction["Predicted Price"] PRINT " Direction = ", prediction["Direction"] PRINT " Relative Error = ", FORMAT(prediction["Relative Error"], percentage format) END FUNCTION // Example usage: CALL display_predictions(predictions_summary, last_original_price)

5️⃣ Bringing It All Together

The following sequence orchestrates all components.


BEGIN // Step 1: Fetch and transform stock data transformed_results, original_results ← CALL fetch_transformed_stock_data(symbol, start_date, end_date) // Check if sufficient data is available IF LENGTH(transformed_results) < lot_size THEN PRINT "Not enough data for the specified lot size." EXIT // Step 2: Use last 'lot_size' values for prediction subset_transformed ← EXTRACT last lot_size values from transformed_results subset_original ← EXTRACT last lot_size values from original_results // Step 3: Generate numerical predictions using Bayesian Gaussian Mixture Model predictions_summary ← CALL predict_directions_and_magnitudes(subset_transformed, original_results, num_predictions) // Step 4: Display the computed predictions IF predictions_summary is NOT EMPTY THEN CALL display_predictions(predictions_summary, subset_original[-1]) END

📜 Disclaimer: No Financial or Investment Advice

This post presents technical demonstrations related to statistical modeling and data processing.

🚨 No Investment Advice
This post does not provide financial, investment, or trading recommendations. The content is for educational and informational purposes only.

📉 No Guarantees
Any methodologies presented are for theoretical exploration and do not guarantee accuracy or financial outcomes.

📜 No Liability
The author assumes no responsibility for any financial losses resulting from the use of this information.

Always consult a qualified financial professional before making investment decisions.


🔗 Attribution and Credits

This blog post incorporates open-source tools for numerical analysis and statistical modeling.

🧠 Attribution to OpenAI & ChatGPT

This post was structured with AI-assisted explanations using ChatGPT, developed by OpenAI.
🔗 https://openai.com

📊 Attribution to Yahoo Finance

Stock data is sourced from Yahoo Finance via yfinance.
🔗 Yahoo Finance

📈 Attribution to SciKit-Learn for Bayesian Gaussian Mixture

The BGMM modeling is implemented using sklearn.mixture.BayesianGaussianMixture from SciKit-Learn.
🔗 Scikit-Learn Documentation

Comments

Popular posts from this blog

Evolving Activation Functions: A Personal Exploration with Transformers

Analyzing Stock Trends with Bollinger Bands, RSI, and MACD