Gaussian-Based Stock Price Smoothing & Band Calculation
Smoothing Stock Price Data with Gaussian Filters: Visualizing High-Low Bands
In this guide, we explore how to smooth stock price data using a Gaussian filter and visualize Gaussian High-Low bands for improved market analysis. This technique helps traders reduce noise in stock price movements, making it easier to identify key price ranges and trends with greater clarity.
With advancements in Large Language Models (LLMs) like ChatGPT, Gemini, and DeepSeek R1, converting pseudo-code into a fully functional stock analysis script is now effortless. This allows traders and developers to implement Gaussian-based trend analysis in their preferred programming language with ease.
1️⃣ Fetching Stock Data
To analyze stock trends, we first retrieve historical stock prices using Yahoo Finance.
📌 Why Use Historical Data?
- Stock prices are noisy, and short-term fluctuations can obscure trends.
- By retrieving and smoothing price data, we can gain a clearer picture of market behavior.

2️⃣ Applying Gaussian Smoothing
Gaussian smoothing is a technique that helps reduce noise in data while preserving important patterns.
📌 Why Gaussian Smoothing?
- Eliminates short-term price noise, making trends easier to interpret.
- Helps define a price channel without sharp fluctuations.
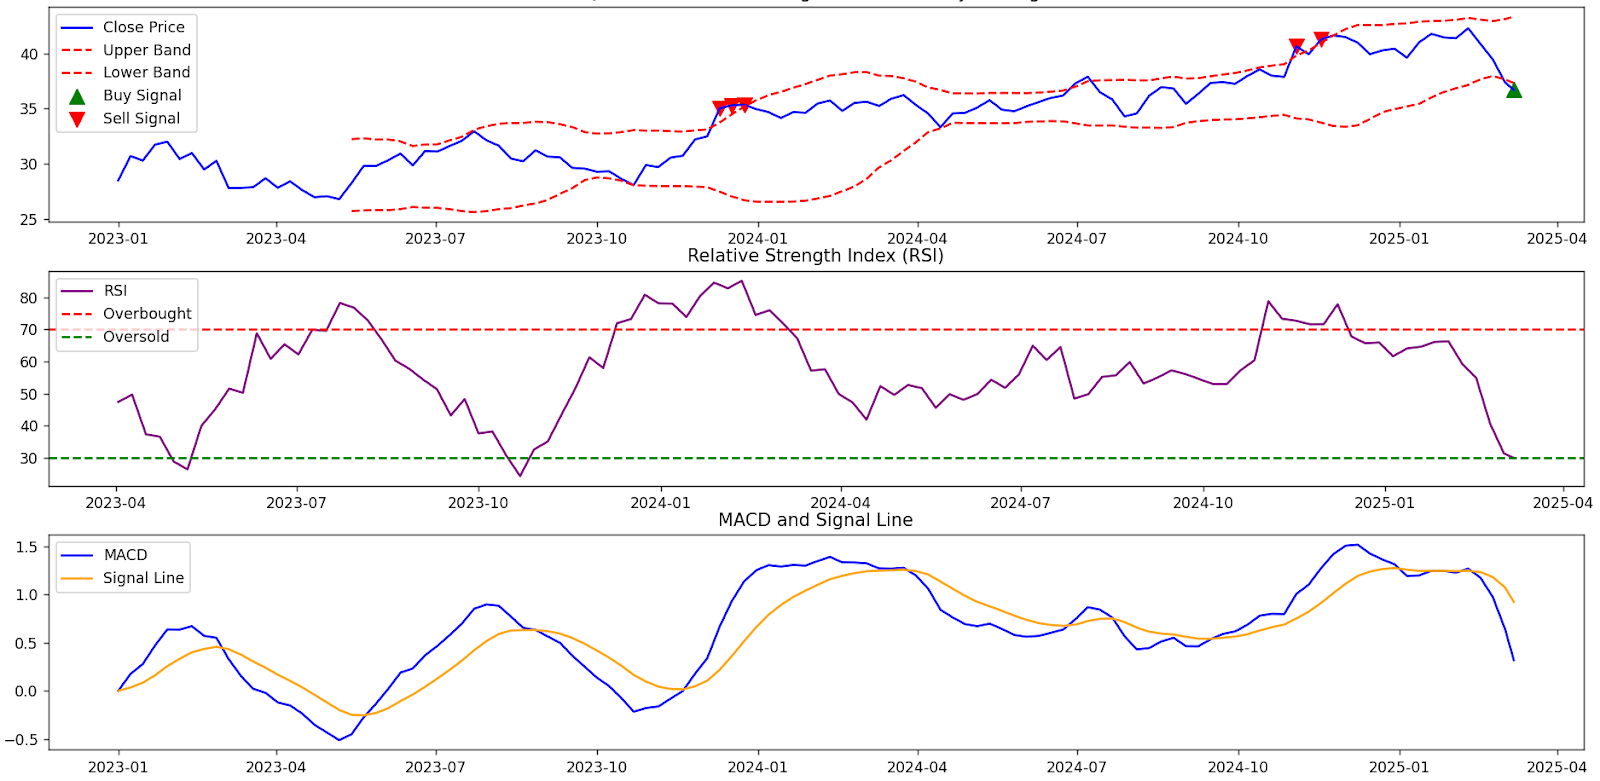
3️⃣ Visualizing the Gaussian-Based Bands
Once the Gaussian smoothing is applied, we plot the results to observe how the bands form around the stock price.
📌 Why Gaussian Smoothing?
- Eliminates short-term price noise, making trends easier to interpret.
- Helps define a price channel without sharp fluctuations.
4️⃣ Estimating Tomorrow’s Price Range
To provide a basic future range estimate, we take the last computed values of the Gaussian bands.
📌 Why Estimate Tomorrow’s Price Range?
- Provides an approximate price movement zone based on smoothed historical data.
- Helps traders anticipate support and resistance levels for short-term strategies.
5️⃣ Bringing It All Together
Now, let's combine all components into a structured execution sequence.
🎯 Key Takeaways
✅ Gaussian Smoothing eliminates noise and highlights key price zones.
✅ Gaussian Bands serve as dynamic support/resistance levels.
✅ Future Price Range Estimation gives traders an approximate movement area for the next day.
📜 Disclaimer: No Financial or Investment Advice
The information in this blog post, including stock analysis, smoothing techniques, and Gaussian bands, is provided for educational and informational purposes only.
🚨 Not Investment Advice
This post does not constitute financial or investment advice. I am not a licensed financial advisor, and no information here should be interpreted as a recommendation to buy, sell, or trade securities or financial instruments.
📉 Trading Risks
Stock trading and investing involve significant risk, including the potential loss of capital. There is no guarantee that any analysis method, including Gaussian bands, will result in profitable trades.
💡 Use at Your Own Risk
The code and analysis provided are for demonstration purposes only. Any decisions based on this information are made at your own discretion.
📜 No Liability
Under no circumstances shall I be liable for any direct, indirect, or consequential losses resulting from the use of this information.
Always consult with a qualified financial professional before making investment decisions.
Attribution and Credits
This post leverages open-source tools for stock analysis. Proper credits are given below:
🧠 Attribution to OpenAI & ChatGPT
This post was enhanced with AI-assisted structuring and explanation using ChatGPT, developed by OpenAI.
🔗 https://openai.com
📊 Attribution to Yahoo Finance
Stock data is retrieved from Yahoo Finance using yfinance.
🔗 Yahoo Finance
📈 Attribution to SciPy for Gaussian Filtering
The Gaussian smoothing technique utilizes the scipy.ndimage.gaussian_filter1d function from SciPy, an open-source Python library for scientific computing.
🔗 SciPy Documentation

Comments
Post a Comment