Stock Analysis: Resistance Levels & Forecasting with Meta Prophet
Using Python for Stock Analysis: Forecasting and Resistance Levels with Meta Prophet
In this guide, we explore a Python-powered stock analysis tool designed to help traders identify resistance levels using Meta Prophet. This step-by-step walkthrough presents a pseudo-code representation of the program, breaking down each component in a structured and easy-to-follow format.
With advancements in Large Language Models (LLMs) like ChatGPT, Gemini, and DeepSeek R1, converting pseudo-code into a fully functional Python trading script is now seamless. This makes it easier for traders and developers to implement stock forecasting algorithms in their preferred programming language.
1️⃣ Fetching Stock Data
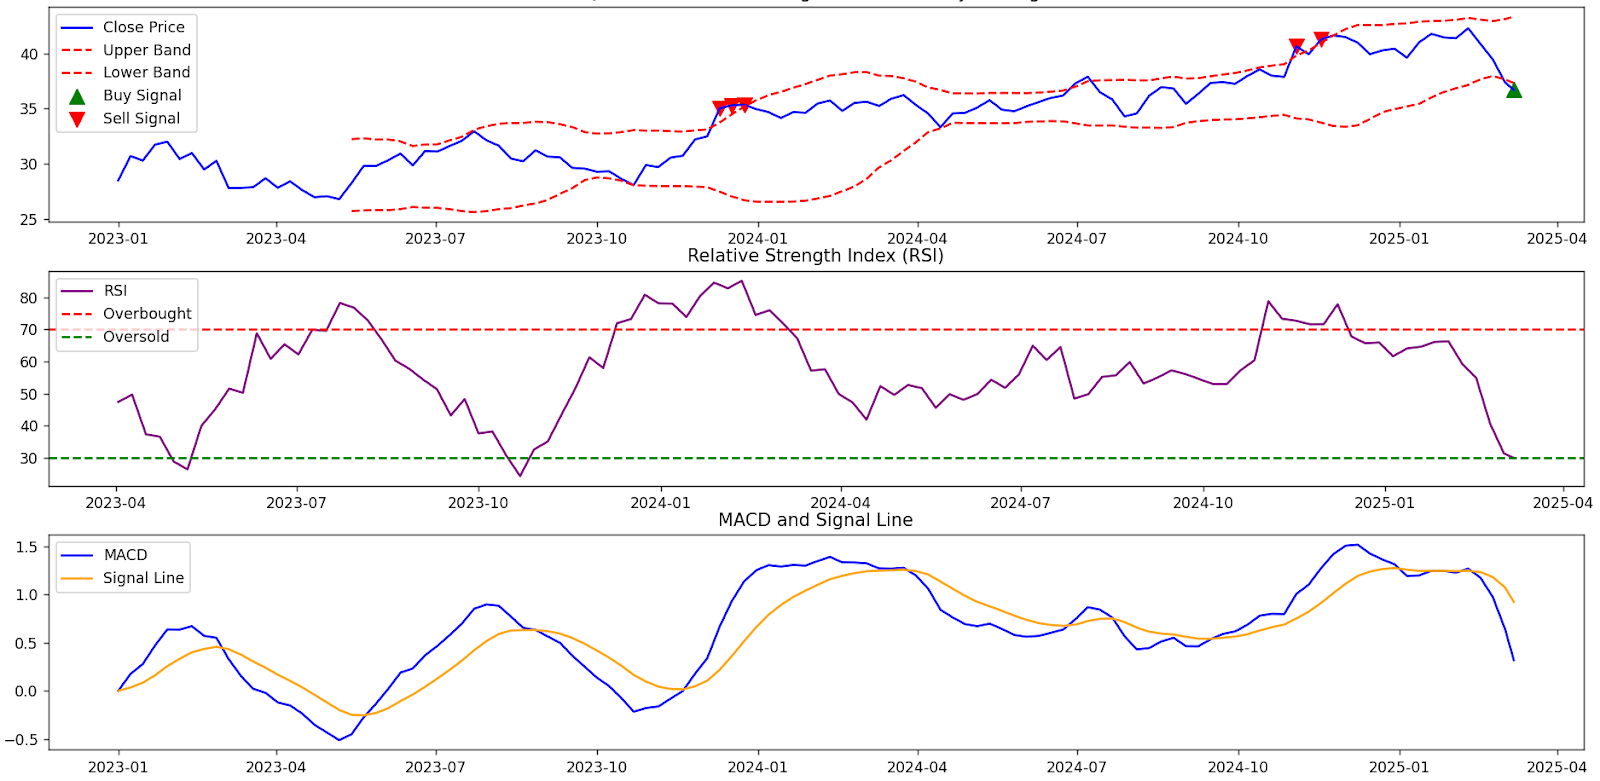
Before performing any analysis, we need historical stock data. In this example, we fetch data for BOTZ from Yahoo Finance, starting from January 1, 2024, up to the end of 2025.
📌 Why Fetch Historical Data?
To analyze price trends, we need past data. By retrieving weekly price movements, we can identify key trading levels and patterns.
example plot:

2️⃣ Identifying & Plotting Resistance Levels
A resistance level is a price point where a stock struggles to break through. Traders use resistance levels to detect potential price ceilings where selling pressure may increase.
3️⃣ Forecasting Stock Prices Using Meta Prophet
Prophet is an advanced time-series forecasting model that helps predict future price movements using historical trends. Here, we use Prophet to forecast stock prices for the next 30 days.
📌 Why Use Prophet for Stock Forecasting?
- Prophet detects trends and seasonal patterns in stock prices.
- It helps project future movements based on historical data.
4️⃣ Bringing It All Together
Now that we have defined the data fetching, resistance analysis, and forecasting functions, let’s bring them together into the main execution block.
🎯 Key Takeaways
✅ Resistance Levels help identify price ceilings where stocks may struggle to break higher.
✅ Prophet Forecasting provides data-driven predictions for future stock trends.
Disclaimer: No Financial or Investment Advice
The information presented in this blog post, including stock analysis techniques, trading indicators, and forecasting models, is for educational and informational purposes only.
🚨 Not Financial or Investment Advice
This blog does not provide financial, investment, legal, or trading advice. I am not a licensed financial advisor, investment professional, or broker. The stock analysis and forecasting techniques demonstrated in this post are for illustrative purposes only and should not be considered a recommendation to buy, sell, or trade any financial assets.
📉 Risk Disclosure
Trading and investing involve substantial risk, and past performance is not indicative of future results. There is no guarantee that the methods outlined in this blog will yield positive returns. You should conduct your own due diligence and consult with a qualified financial professional before making any investment decisions.
💡 Use at Your Own Risk
Any code, software, scripts, or stock forecasts shared in this post are for demonstration purposes only. By using any of the information provided, you agree that you are solely responsible for any financial losses or outcomes that may result.
⚖ Regulatory Compliance
Different countries and jurisdictions have different rules regarding stock trading and investment forecasting. You are responsible for ensuring that your activities comply with the applicable laws and financial regulations in your region.
📜 No Liability
Under no circumstances shall I be held liable for any direct, indirect, incidental, or consequential losses arising from the use of this information.
✅ Final Note
If you are uncertain about any trading decision, consult with a professional financial advisor before proceeding.
By using this blog and its content, you acknowledge that you understand and accept this disclaimer in full.
🔗 Attribution and Credits
This blog post contains AI-generated content, financial data analysis, and forecasting methods. The following attributions apply:
🧠 Attribution to OpenAI & ChatGPT
This blog post includes content, narratives, and pseudo-code generated with assistance from ChatGPT, an AI model developed by OpenAI. ChatGPT was used to enhance clarity, structure, and explanation of the technical concepts.
For more details on OpenAI and ChatGPT, visit https://openai.com.
📊 Attribution to Yahoo Finance
Stock price data is retrieved from Yahoo Finance using the yfinance Python package. Yahoo Finance is a publicly accessible financial data provider, and all stock prices used in this analysis are subject to their terms of service.
For more details, visit Yahoo Finance.
📈 Attribution to Meta Prophet
The Prophet forecasting model used in this analysis is an open-source time-series forecasting tool developed by Meta (formerly Facebook). Prophet is designed for trend forecasting with seasonality detection and is widely used in predictive analytics.
📌 Prophet GitHub Repository: https://github.com/facebook/prophet
📌 Meta Prophet Documentation: https://facebook.github.io/prophet/
This post utilizes Prophet to demonstrate stock price forecasting, but it should not be used in isolation for investment decisions.

Comments
Post a Comment