Posts

Showing posts from March, 2025

Bayesian Gaussian Mixture Modeling for Stock Price Transformation & Prediction

Stock Price Prediction Using Bayesian Gaussian Mixture Model (BGMM) In this guide, we explore the Bayesian Gaussian Mixture Model (BGMM) and its application in transforming stock price data and generating numerical predictions . This method leverages historical stock data from Yahoo Finance , applies data transformation techniques , and fits a BGMM model to uncover hidden patterns in stock movements and make data-driven market forecasts . The following example is presented in pseudo-code format , allowing for easy adaptation into any programming language. With modern Large Language Models (LLMs) like ChatGPT, Gemini, and DeepSeek R1 , converting pseudo-code into a fully functional stock prediction script has never been simpler. 1️⃣ Fetching and Transforming Stock Data Before applying statistical modeling , we first retrieve and transform historical stock price data. FUNCTION fetch_transformed_stock_data(symbol, start_date, end_date) TRY / / Download stock dat...

Gaussian-Based Stock Price Smoothing & Band Calculation

Image
Smoothing Stock Price Data with Gaussian Filters: Visualizing High-Low Bands In this guide, we explore how to smooth stock price data using a Gaussian filter and visualize Gaussian High-Low bands for improved market analysis. This technique helps traders reduce noise in stock price movements , making it easier to identify key price ranges and trends with greater clarity. With advancements in Large Language Models (LLMs) like ChatGPT, Gemini, and DeepSeek R1 , converting pseudo-code into a fully functional stock analysis script is now effortless. This allows traders and developers to implement Gaussian-based trend analysis in their preferred programming language with ease. 1️⃣ Fetching Stock Data To analyze stock trends, we first retrieve historical stock prices using Yahoo Finance. BEGIN // Define the stock ticker and date range DEFINE ticker AS "BOTZ" DEFINE start_date AS "2024-01-01" DEFINE end_date AS "2025-12-31" ...

Stock Analysis: Resistance Levels & Forecasting with Meta Prophet

Image
Using Python for Stock Analysis: Forecasting and Resistance Levels with Meta Prophet In this guide, we explore a Python-powered stock analysis tool designed to help traders identify resistance levels  using Meta Prophet . This step-by-step walkthrough presents a pseudo-code representation of the program, breaking down each component in a structured and easy-to-follow format . With advancements in Large Language Models (LLMs) like ChatGPT, Gemini, and DeepSeek R1 , converting pseudo-code into a fully functional Python trading script is now seamless. This makes it easier for traders and developers to implement stock forecasting algorithms in their preferred programming language. 1️⃣ Fetching Stock Data Before performing any analysis, we need historical stock data . In this example, we fetch data for BOTZ from Yahoo Finance, starting from January 1, 2024 , up to the end of 2025 . BEGIN // Define stock symbol and date range DEFINE ticker AS "BOTZ" DEF...

Analyzing Stock Trends with Bollinger Bands, RSI, and MACD

Image
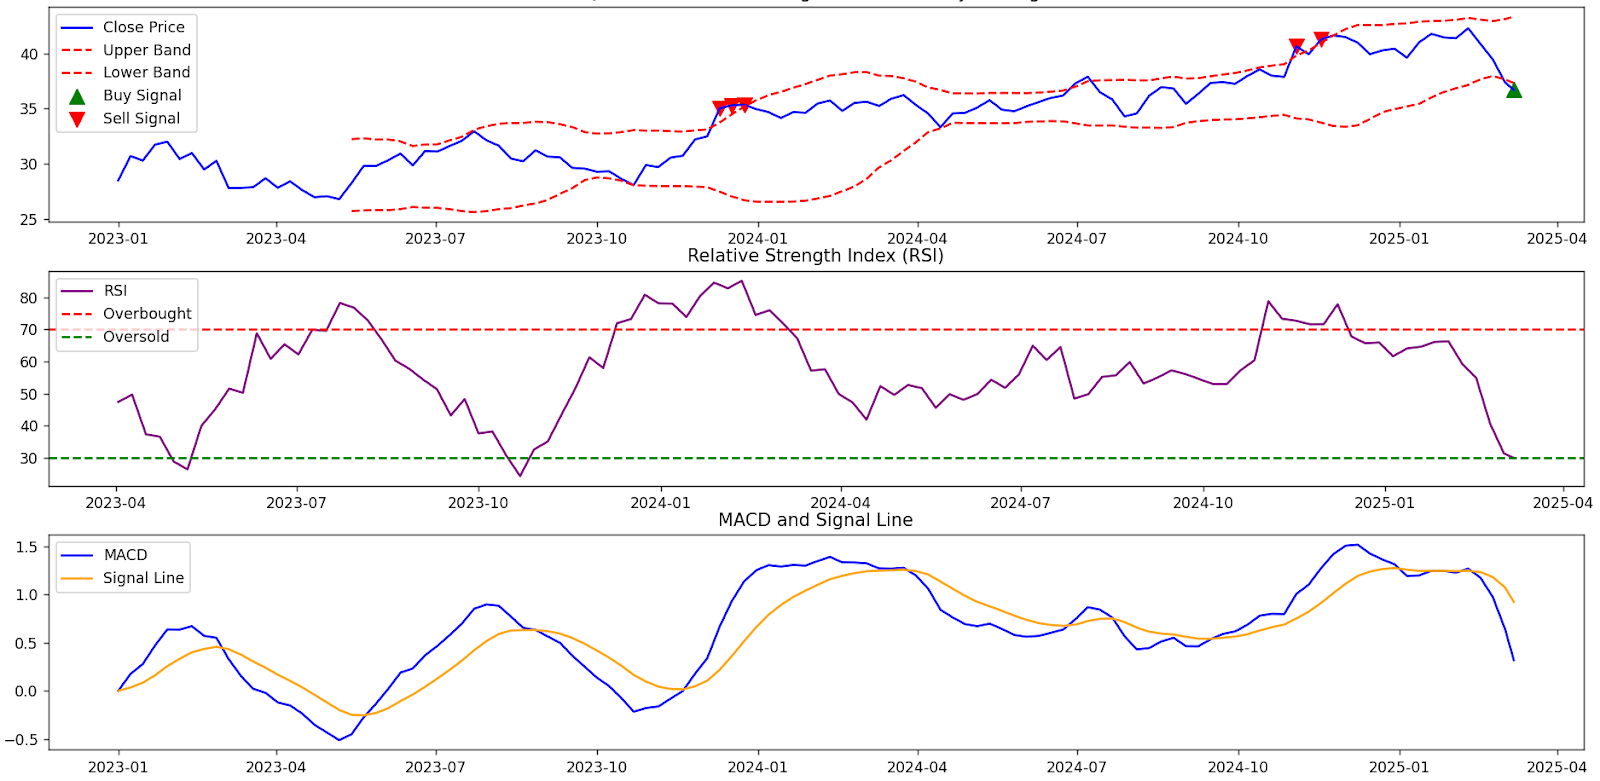
  Introduction Successful trading and investing rely on effective stock market analysis tools to identify trends and potential trade signals. Whether you're a beginner learning technical analysis or an experienced trader optimizing strategies , using key technical indicators can enhance decision-making. In this guide, I'll walk you through a trading algorithm framework that fetches real-time stock data and computes essential indicators like Bollinger Bands, RSI (Relative Strength Index), and MACD (Moving Average Convergence Divergence) . You'll also learn how to visualize stock trends for better insights. This stock analysis script is especially useful for swing traders and active investors looking to identify potential trade signals and refine their trading strategies. What This Trading Algorithm Does This automated trading analysis script simplifies the process of retrieving stock market data and analyzing it with technical indicators . The provided pseudo ...